50 Farmers' Tales

Featured story

GIS analysis

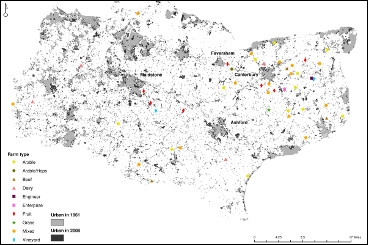
This section of the archive contains maps and other spatial information collected as part of the 50 Farmers’ Tales project. We were interested in a county-wide perspective on change in Kent over the last 50 years, to give some context to the 50 interviews we conducted with farmers on their particular experiences with changes on their farms.

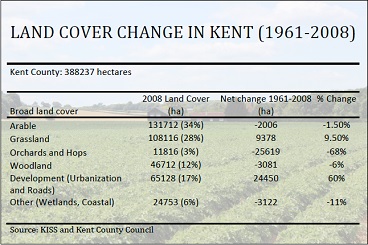
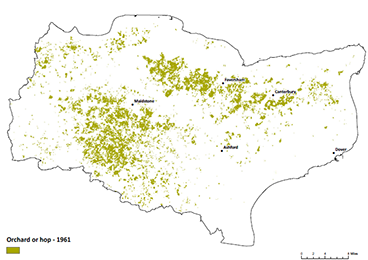
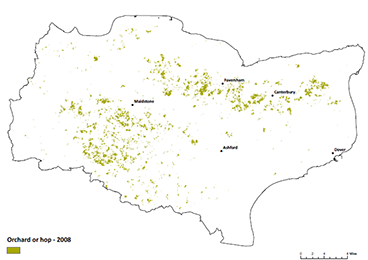
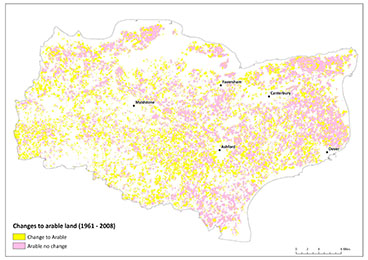
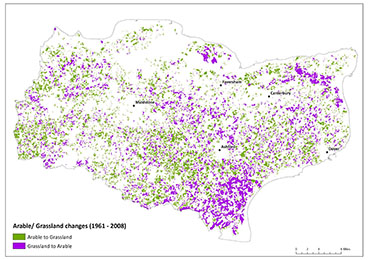
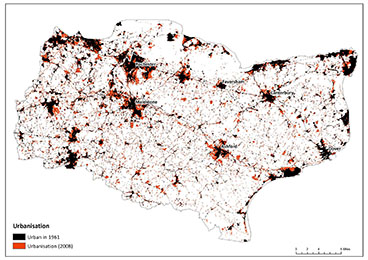
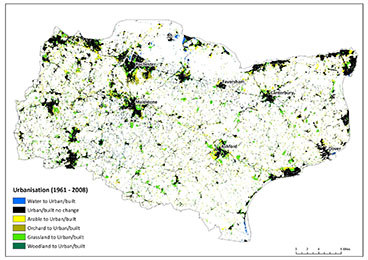
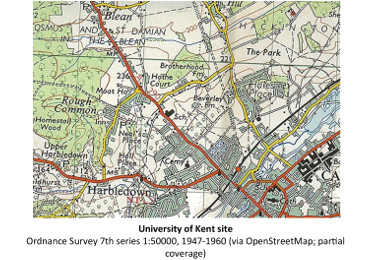
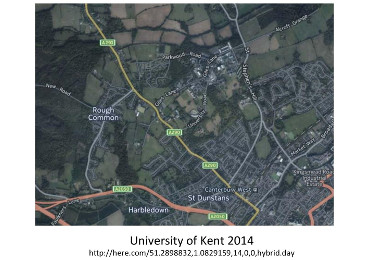
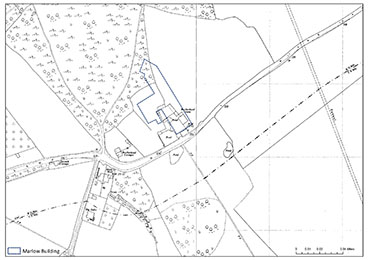
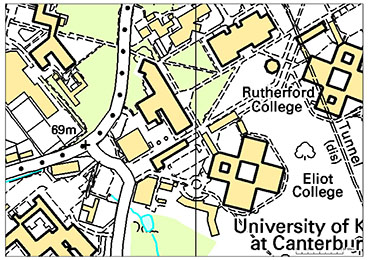
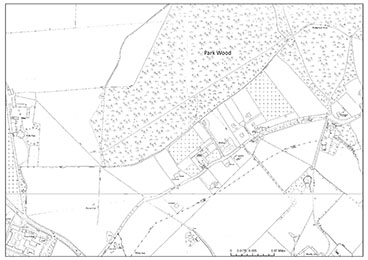
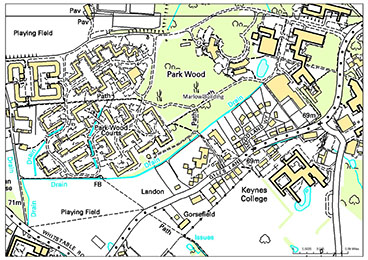
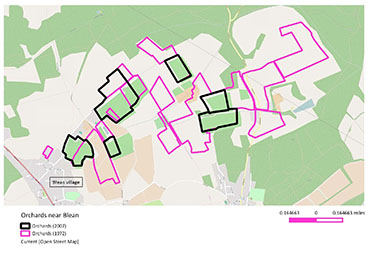
Here, you’ll find old maps of the area around the University of Kent at Canterbury, plus a series of maps showing changes in land use and land cover between 1961 and 2008, which is as close as we could get, in terms of available data, to our study period from 1965-2015. This GIS analysis was conducted by Dr Dimitrios Bormpoudakis and Dr Joseph Tzanopoulos at the Kent Interdisciplinary Centre for Spatial Studies (KISS), with data provided by Kent County Council’s ARCH project (Assessing Regional Habitat Change).

A. Kent county maps

1. 50 Farmers’ Tales, locations in Kent

This map shows the locations and farm types of the farmers interviewed for the archive on a basemap showing increasing urbanisation in Kent between 1961 and 2008.

2. Land use changes, statistics 1961-2008

This table shows the changes in land use and land cover, in hectares, across Kent between 1961 and 2008. A dramatic loss of orchards and hops, a smaller loss of woodlands, coastal and wetlands, is contrasted with a huge increase in urban areas, developments, roads and grasslands. Arable cropping has remained about the same in area, but many farms have transformed in different ways. See the other GIS maps to see how these changes are distributed across the county.

3. Orchards and hops 1961

4. Orchards and hops 2008

5. Arable land changes 1961-2008

This map shows the continuity of arable farming plus land converted to arable between 1961 and 2008. It does not show arable land that was converted to other land uses, which led to a decrease of 1.5% in arable farming area over this period. See other maps.

6. Arable grassland changes 1961-2008

This map shows both grassland areas that were converted to arable farming and arable farming that was converted to grasslands. Across Kent, grasslands increased by 11% during this period while arable decreased by 1.5%.

7. Urbanisation 1961-2008

This map shows the expansion of urban areas, housing and other developments and roads. There was a 60% increase in these urban areas and developments between 1961 and 2008.

8. Conversion to urban areas 1961-2008

This map shows the conversion of various rural land cover and uses in Kent to urban areas, housing and other developments and roads. There was a 60% increase in these urban areas and developments between 1961 and 2008. Kent’s population increased from about 1.35 million to 1.8 million people (to a density of 2.1 persons per acre, twice the national average), while the proportion of agricultural workers has decreased from about 3% to less than 1% in that time.