If you keep track of key measures of disability equality in the UK, you’ll know that the gap in employment rates between disabled and non-disabled working-age people has gone down over the past fifteen years. And you’d be in good company. Many experts have flagged this trend: from Dame Carol Black back in her influential 2008 review to a recent paper in the BMJ, and it’s one of the key DWP indicators that they regularly publish (and indeed write press releases about).
But if you thought this, you might be wrong.
At the same time as one group of people were talking about the disability employment gap going down, another group – including two papers in the BMJ and a report by the excellent Richard Berthoud – were writing about how the disability employment gap was going up. Partly this is because the latter group were looking over a longer period (from the late 1970s), but even focusing on the same, recent period, this latter group find no change in the disability employment rate. Strange though it may seem, the difference is simply because the former group were using one survey (the Labour Force Survey, ‘LFS’), while the latter were using a different one (the General Household Survey, ‘GHS’).
Frustrated by the fact that these two groups hadn’t acknowledged the existence of each other, Melanie Jones, Victoria Wass and I decided to try investigate this more closely. There are lots of possible differences between surveys: differences in the methods they use to interview people (e.g. telephone or face-to-face), differences in areas of the country they include, and many others. We looked into all of these details, and restricted our analysis to only those parts of the surveys that were strictly comparable (‘harmonisation’). We also added in a third high-quality survey that no-one had previously used, the Health Survey for England (‘HSE’), to see what trend this showed.
The results are shown in a new paper in the journal Social Science and Medicine – which is available open-access – and which we explain in the rest of this blog. Just to clarify: the paper itself shows figures and tables for each of three stages of harmonisation, but here we focus on the results for the three surveys after we’ve made them as comparable as possible in terms of survey methods, but before we’ve adjusted them to have the same age/sex/education make-up as each other (in the paper this is ‘Sample 2’). When we talk about ‘disability’, we’re talking about people who say that they have a longstanding illness or disability that limits their daily activities; the results for longstanding illness are basically the same, and shown in the paper.
Does harmonisation make the three surveys tell the same story?
So after we exhaustively make these three surveys as comparable as possible – dealing with methodological differences by restricting ourselves to only face-to-face interviews, looking only at England, ignoring proxy responses, ignoring follow-up interviews of those who had previously been interviewed and only looking at new interviewees, and using a consistent definition of ‘employment’ – do we find that the surveys tell the same story?
No.
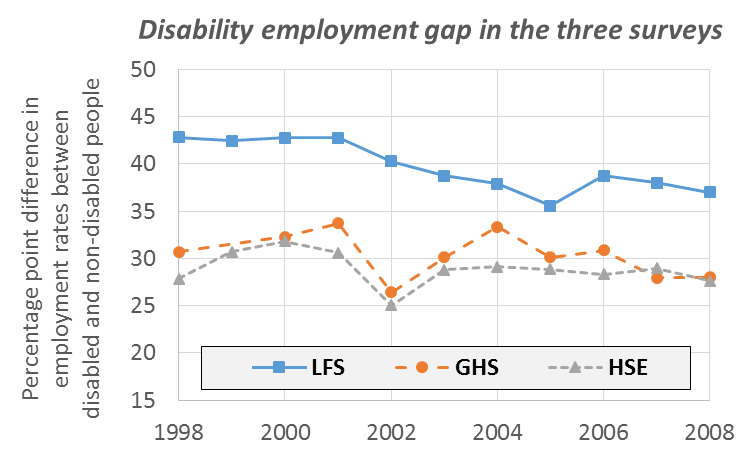
While the patterns are slightly more similar, we basically find the same puzzling result: the LFS shows a cheering trend towards labour market equality, which is simply not visible in the HSE or GHS. You can see this in the below.

Why do different surveys show different trends?
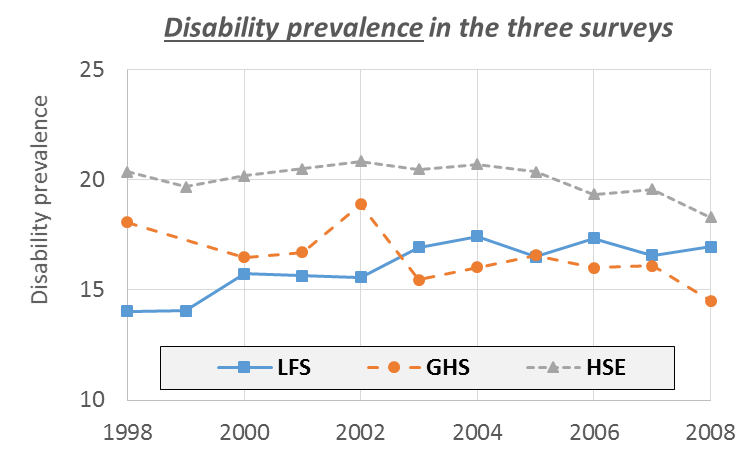
We don’t know for sure why the different surveys show different trend, but there are some signs that it’s the positive trend in the LFS that we should ignore. Look at the trends in disability itself in the three surveys, shown below. In the HSE and GHS, disability has been relatively stable – if anything it’s been falling over time. However, disability in the LFS has been rising steadily.
What’s more, there’s a very strong association in the LFS across survey years, so that when more people say they’re disabled, disability employment is smaller. This makes sense – the people who are at the borderline of reporting a disability are likely to be less severely disabled than people who will definitely report a disability.
In other words, what the LFS seems to be showing is not the good-news story that the disability employment gap is going down. Instead, it seems to be telling us the bad-news story that disability itself is going up. However, this is still slightly speculative; we’re trying to look more closely at who seems to be responding differently to the LFS than the other surveys in a follow-up paper, and we’ll tell you as soon as we know…
